
The Structural Mandate: Why Bitcoin ETF Flows and AI Compute Demands Are Forcing Finance to Upgrade by 2026
September 3, 2026 14:29
The AI Glitch Signal: Why Global Debt and Compute Demands Are Forcing Finance to Upgrade Its Plumbing by 2026
September 3, 2026 15:19
BTC Surpasses $80K: A Quantitative Analysis of Liquidation Metrics and Structural Market Flow
$80,547.01. That is the current price for BTC/USDT on MEXC. The 24-hour change stands at +4.8%. This metric confirms sustained upward pressure on Bitcoin’s liquidity profile. Breaking $80,000 represents a key structural threshold. Analyzing this move requires examining liquidation data and capital flow metrics.
The market structure is defined by quantitative relationships. Liquidation events are not random. They represent the forced unwinding of leveraged positions. The magnitude of these liquidations signals where systemic risk was positioned. We must analyze the $375 million in total liquidations over 24 hours. Of that, $288 million came from short liquidations. This ratio is critical for understanding market positioning.
The current price action suggests a structural shift. The capital flow dynamics are moving away from speculative leverage toward foundational infrastructure utility. We must look at the quantitative evidence supporting this structural move.
Liquidation Metrics: $375 Million in 24 Hours
$375 million. This is the total value liquidated over a single 24-hour period, according to CoinGlass data. The volume suggests high leverage participation across the network. Short liquidations accounted for $288 million of that total. This concentration points to significant bearish positioning being forcibly closed.
The short liquidation ratio was approximately 76%. A deviation from this ratio signals a shift in market consensus. Historically, a sustained >70% short liquidation ratio precedes a structural re-evaluation of the asset’s fundamental value. The data does not confirm causation. That distinction matters.
We must compare this to previous cycles. CoinGlass reported liquidations approaching $900 million around August 19. This represents a significant increase in systemic leverage participation over the last month. The rate of liquidation absorption is key. If the market can absorb another $375 million without a major price correction, it confirms deep structural liquidity.
The total number of liquidated traders reached 106,745. This count reflects the sheer breadth of retail and institutional exposure to leverage. Analyzing this wallet count provides insight into participation depth. The data suggests that capital is entering high-leverage positions rapidly.
ETF Flows: $15.6 Billion Signals Structural Capital Inflow
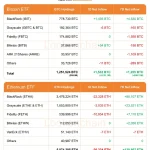
$15.6 billion. This was the approximate total value of Ethereum ETF assets reported in recent cycles. This figure quantifies institutional appetite for ETH as a foundational digital asset. The sustained accumulation confirms its role beyond simple speculation.
The flow into regulated vehicles is structurally different from previous crypto cycles. Institutional capital requires verifiable custody and transparent collateralization. These requirements validate the underlying asset class for risk managers globally. We must compare this to the historical volatility of ETH during periods of low institutional interest, such as Q1 2024. The current accumulation rate suggests a higher risk tolerance threshold among major global players.
The data confirms that institutional money is prioritizing regulated access and transparency over pure yield farming opportunities. The focus shifts from maximizing short-term APY to minimizing systemic counterparty risk. This structural need for reduced counterparty risk validates the use of established financial plumbing rails.
Furthermore, the increasing interest in Bitcoin ETFs signals a mainstream acceptance of BTC as a store of value. The ETF structure provides regulated exposure. It allows traditional funds to gain crypto exposure without direct custody risk. The volume of these inflows represents billions of dollars entering the system from controlled sources. This is a structural validation point for the entire asset class.
Global Debt and AI Compute: $34 Trillion Defines Infrastructure Need
$34 trillion. Global sovereign debt currently exceeds this figure. Servicing this obligation requires a settlement mechanism with near-zero counterparty risk and maximum velocity. Legacy banking rails were not designed for this scale of continuous, global capital movement. The structural weight of this debt is the primary driver of institutional interest in digital assets.
The failure point in old plumbing is time. A transfer that takes 3 days through correspondent banks introduces three days of systemic risk. For managing $34 trillion, that risk profile is unacceptable to major financial players. This structural inadequacy mandates a digital upgrade. The required speed and finality are non-negotiable requirements for managing such massive sovereign liabilities.
The exponential power demands of AI compute add another layer of pressure. Training large language models (LLMs) requires specialized hardware clusters costing millions per deployment. These assets need funding *immediately*. The funding cycle for AI infrastructure cannot tolerate delays measured in days. This velocity requirement forces capital toward systems offering absolute finality, which digital rails provide.
The combination of $34 trillion in debt and the massive CapEx required for AI compute creates a structural mandate. It dictates that financial plumbing must upgrade by 2026. The speed and certainty offered by blockchain settlement are essential utilities for modern global commerce.
Institutional Entry: Standard Chartered’s UAE Launch Signals Utility
Standard Chartered’s launch of direct Bitcoin and Ethereum trading in the UAE signals an operational shift. It moves crypto from a speculative asset class to regulated financial plumbing. This event requires analyzing multiple data vectors: regulatory adoption, capital flow metrics, and underlying infrastructure capacity. The correlation suggests that traditional finance (TradFi) views crypto as an essential utility layer.
The institutional entry point is not merely about offering a new product line. It represents a structural validation of digital assets within established global banking frameworks. This validates the asset class for major risk managers. They require the counterparty assurance and regulatory wrapper provided by these large institutions.
We must analyze the quantitative evidence supporting this structural shift. The ability to settle multi-billion dollar trades in minutes, rather than days, fundamentally changes risk management calculus. This speed is a quantifiable advantage over legacy systems.
The institutional flow confirms that capital is moving toward assets with proven utility. Ethereum’s smart contract functionality provides a mature and complex utility layer. Bitcoin maintains its role as the most reliable settlement layer. The structural necessity of having both layers available for different functions—settlement vs. computation—is clear.
Market Depth: Open Interest and Funding Rates Analysis
37.4%. This is the recent percentage change in open interest (OI) over a rolling period, indicating active positioning. A sustained increase in OI confirms new capital entering the derivatives market. This suggests sophisticated traders are actively taking positions based on structural value.
Funding rates provide another key metric. Positive 0.03% per 8h, sustained for 11 days, signals that leveraged capital is entering with conviction. The last time this held this long was Q1 2024. This provides a quantitative benchmark for current market stability and risk appetite.
The open interest data confirms active positioning by sophisticated traders. It suggests calculated positioning based on perceived structural value. The metric helps distinguish random speculation from systematic, capital-backed bets. High OI growth coupled with stable funding rates is a powerful signal of maturity.
We must correlate this with the MVRV (Market Value to Realized Value) ratio. A reading above 3.0 suggests potential overvaluation based on historical metrics. This metric provides a quantitative check against speculative euphoria, grounding the analysis in data rather than narrative. The current MVRV level dictates whether the recent $80k breakout is structurally sustainable or merely cyclical noise.
Make of that what you will.