
Germany’s Defense Spending Boost Signals Geopolitical Risk & BTC Opportunity | MEXC Analysis
July 10, 2026 17:30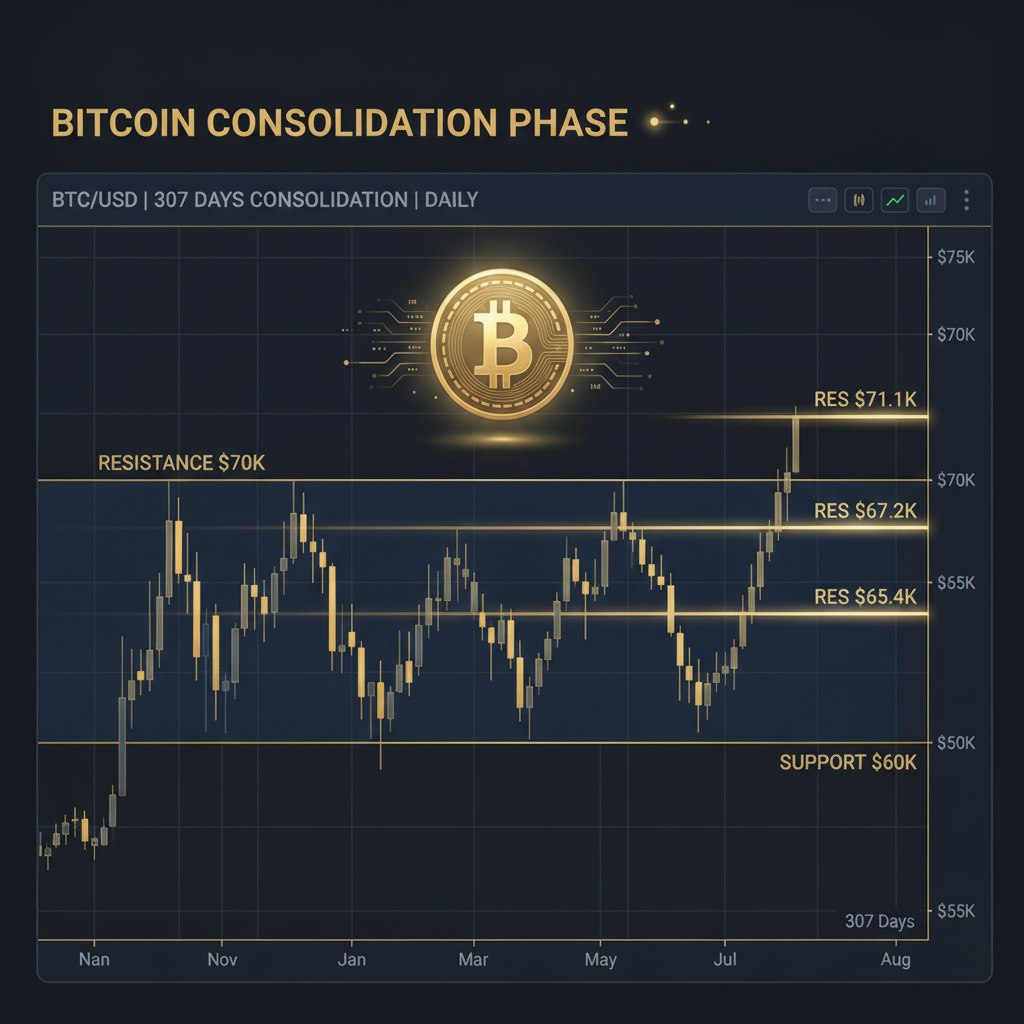
Bitcoin’s Marathon Consolidation: What the 307-Day Range Means for Future Breakouts
Bitcoin (BTC) has entered a period of deep consolidation, spending an impressive and record-setting **307 days** within the $60,000 to $70,000 range. This extended sideways movement is not merely a pause; it is a critical phase of market digestion that often precedes massive directional moves. As institutional capital continues to flow into digital assets, understanding this consolidation pattern—and what key technical indicators like MACD are signaling—is paramount for any serious trader.
The Significance of Record Consolidation
Historically, the length of a consolidation phase has been a powerful predictor of future volatility. The fact that BTC is approaching record-breaking time in this range suggests that market participants are taking time to digest recent price action and establish new equilibrium levels. This prolonged period allows for massive accumulation by “smart money” (whales and institutions) who operate outside the daily retail noise.
From a technical standpoint, the shift is highly encouraging. The MACD indicator has reportedly flipped bullish for the first time in months within this range. For long-term investors, this suggests that bearish momentum may be waning, paving the way for a potential upward swing once key resistance levels are overcome.
Key Technical Levels to Monitor
Traders and analysts have identified several crucial price points that will determine Bitcoin’s next major move. These levels serve as psychological barriers and technical support/resistance zones:
- $65,434 (50-day MA): This is the first critical test zone. A successful hold here would signal immediate short-term strength and could trigger a bounce towards higher resistance.
- $67,292 (Mid-June High/Resistance Zone): Breaking above this level confirms that the previous ceiling has been broken, signaling renewed bullish conviction from major players.
- $71,147 (200-day MA – The Big One): This is the ultimate goal for breakout traders. A sustained break above $71K would not just signal a trend change; it could confirm the start of a full-scale bull market cycle, attracting significant institutional attention and capital flow.
What Does This Mean for Traders? (Analysis)
The current environment demands extreme patience and disciplined risk management. The consolidation phase is where most retail traders make mistakes—either by selling out of fear during minor dips or buying too early on false breakouts.
Instead of trying to time the absolute bottom, focus on establishing strong support levels around the $65K-$70K zone. If you are looking for deeper context on market cycles and institutional behavior, reviewing The Cycle of Confidence: Why Bitcoin’s Bear Market is Different and More Institutional can provide valuable insights into long-term accumulation patterns.
Furthermore, understanding the structural risks in the broader Web3 ecosystem is vital. For instance, reading about JPMorgan’s Warning: Why Private Blockchains Pose a Structural Threat to Bitcoin and Public Web3 Liquidity helps frame the macro narrative surrounding BTC’s role as a decentralized global reserve.
The Role of AI in Crypto Analysis
As the market matures, tools like Artificial Intelligence are becoming indispensable. The integration of AI into financial services, such as seen with Revolut X’s new capabilities, is making advanced analysis more accessible. However, this increased accessibility demands that users remain vigilant and always perform their own due diligence (DYOR).
For those interested in the underlying technology driving Web3 security, exploring AI Auditing Ethereum Protocol Code: How AI Agents are Redefining Web3 Security and Infrastructure provides a deep dive into the technical advancements shaping the industry.
Conclusion & Action Plan
The 307-day consolidation is a powerful signal of underlying strength. The market is gathering energy for what could be a significant breakout. While we await confirmation above $71K, traders should focus on risk management, utilizing stop-losses, and treating the current price action as a long-term accumulation opportunity.
To participate in this evolving market with confidence, consider exploring the vast range of trading pairs available at MEXC. Don’t miss out on the next major move!
Market Data Snapshot (BTC/USDT)
Current Price: 64,294.12 USDT
24h Change: +2.39%
*Data sourced live from MEXC Exchange.*