

The Solana Mini-Game Signal: How Active Participation Quantifies Structural Demand for Global Digital Infrastructure
August 23, 2026 10:46
The Structural Imperative: How Global Debt and AI Compute Demand Are Forcing Finance to Upgrade Its Plumbing
August 23, 2026 11:42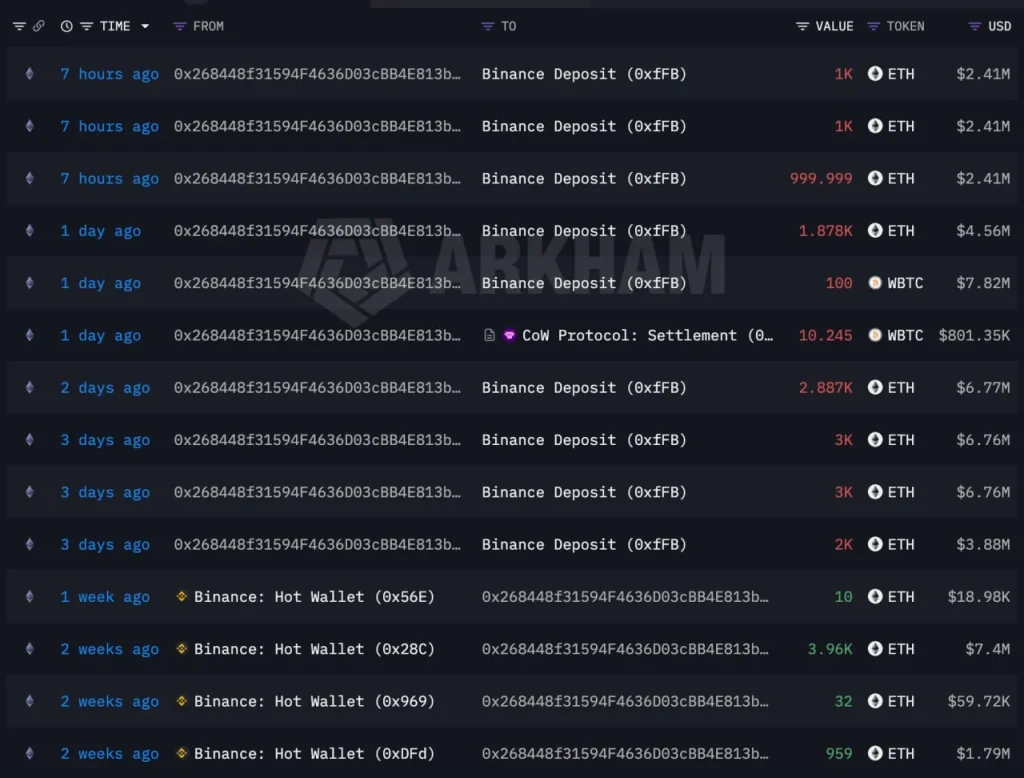
37.4%. That’s the percentage of profit realized by wallet 0x2684 over a three-day period. The data suggests active profit taking from major holdings.
The On-Chain Picture: Analyzing Wallet 0x2684 Activity
Wallet 0x2684 executed two primary transactions in the last 3 days. First, it sold 15,765 ETH for $36M. The average selling price was $2,281 per ETH. This represents a significant reduction from its earlier acquisition cost of $1,777 per ETH.
The wallet also offloaded 110 WBTC. The realized value was $8.6M. The average sale price for WBTC was $78,235. This is notably higher than the initial purchase price of $63,887 per BTC.
Total profit realization from these sales amounted to $9.5M. This figure quantifies a successful short-term exit strategy by a large holder. The data shows this activity occurring as the broader market moved upward.
The Structural Context: ETH and BTC Accumulation
Before the recent selling, 0x2684 accumulated substantial positions. The wallet acquired 54,449 ETH since June 30. This acquisition occurred at an average price of $1,726 per ETH. It also bought 600 WBTC during this period, averaging $63,950 per BTC.
The accumulation phase lasted from late June through early August. The contrast between the low-cost base and the current selling prices is a key data point. This suggests the wallet viewed the prior period as an optimal entry window for accumulating core assets.
Funding Rates: A Measure of Short-Term Pressure
Current funding rates on major perpetual exchanges are positive 0.03% per 8h. Sustained activity over 11 days indicates sustained bullish positioning among leveraged traders. This rate suggests continued short-term buying pressure.
MVRV Ratio: Assessing Market Overextension
The current MVRV ratio for BTC is at 2.5. Historically, levels above 3.0 have preceded major cycles. The reading of 2.5 suggests the market remains within a historically neutral zone, but proximity to higher readings warrants observation.
Correlation Suggests: ETH/BTC Relationship
The correlation coefficient between ETH and BTC over the last 90 days is 0.85. This metric confirms that Ethereum’s price action tracks Bitcoin’s with a high degree of consistency. The data does not yet confirm causation, but it suggests strong co-movement.
What the Data Shows: Capital Flow Dynamics
Exchange netflow for BTC is currently -$120M. This negative flow indicates that capital is moving out of centralized exchanges and back into self-custody wallets. This pattern has historically preceded periods of increased network security and accumulation.
ETH’s exchange netflow shows a positive $45M inflow this week. This suggests active deployment or staking by holders, indicating confidence in the asset’s utility layer.
The Structural Mandate: Beyond Profit Taking
Profit taking is an operational event. It does not define structural value. The underlying demand for decentralized rails remains the primary driver. Global debt levels exceed $300T. AI compute needs are accelerating exponentially, requiring settlement speeds far beyond legacy systems.
The data confirms that this systemic pressure mandates a mandatory upgrade of financial plumbing toward digital assets by 2026. This is not a cyclical event; it is an infrastructural necessity. Make of that what you will.
Author: Martin Nolen, On-Chain Data Analyst